In June, the average PM2.5 concentration across 339 prefecture-level and above cities nationwide was 16.3 micrograms per cubic meter, a year-on-year decrease of 4.7%; the average PM10 concentration was 33 micrograms per cubic meter, a year-on-year decrease of 5.7%; the average O3 concentration was 153 micrograms per cubic meter, a year-on-year increase of 0.7%; the average SO? concentration was 7 micrograms per cubic meter, unchanged year-on-year; the average NO? concentration was 13 micrograms per cubic meter, a decrease of 7.1% year-on-year; and the average CO concentration was 0.7 milligrams per cubic meter, unchanged year-on-year.
In June, the average proportion of days with good air quality in 339 prefecture-level and above cities nationwide was 84.0%, an increase of 5.7 percentage points year-on-year; The average proportion of days with severe or worse pollution was 0.2%, unchanged year-on-year. The average proportion of days with exceedances caused by sandstorms was 0.6%, with 0.2% of those days experiencing severe or worse pollution.
From January to June, the average PM2.5 concentration in 339 prefecture-level and above cities nationwide was 32.1 micrograms per cubic meter, a year-on-year decrease of 2.4%; The average PM10 concentration was 55 micrograms per cubic meter, unchanged year-on-year; the average O3 concentration was 147 micrograms per cubic meter, unchanged year-on-year; the average SO2 concentration was 8 micrograms per cubic meter, unchanged year-on-year; the average NO2 concentration was 20 micrograms per cubic meter, a decrease of 4.8% year-on-year; and the average CO concentration was 1.0 milligrams per cubic meter, a decrease of 9.1% year-on-year.
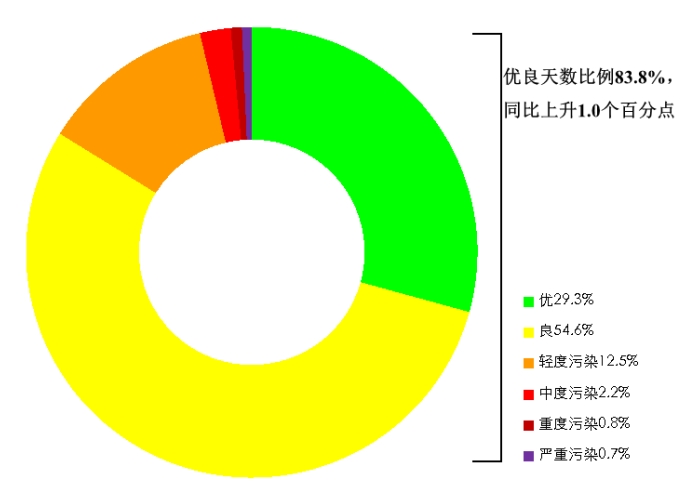
From January to June, the average proportion of days with good air quality among 339 prefecture-level and above cities nationwide was 83.8%, an increase of 1.0 percentage points year-on-year; the average proportion of days with severe or above pollution was 1.5%, unchanged year-on-year. The average proportion of days with exceedances caused by sandstorms was 4.2%, of which the proportion of days with severe or above pollution was 1.0%.

Proportion of days by air quality level in 339 prefecture-level and above cities nationwide from January to June 2025
List of the top 20 and bottom 20 cities in air quality among 168 key cities from January to June 2025
From January to June, among the 168 key cities, the top 20 cities with better air quality were Lhasa, Haikou, Zhangjiakou, Huizhou, Huangshan, Shenzhen, Guiyang, Zhuhai, Xiamen, Fuzhou, Zhoushan, Lishui, Zhongshan, Kunming, Dongguan, Ya'an, Taizhou, Yichun, Chengde, and Zhaoqing; The bottom 20 cities with poorer air quality were Xi'an, Kaifeng, Heze, Xuzhou, Xinxiang, Jiaozuo, Linyi, Anyang, Xiangyang, Xuchang, Hebi, Weinan, Luohe, Lanzhou, Liaocheng, Tianjin, Zaozhuang, Luoyang, and Zhengzhou.
From January to June, among the 168 key cities, the top 20 cities with the best improvement in air quality were Xinzhou, Hohhot, Baotou, Yangquan, Jinzhong, Linfen, Handan, Datong, Binzhou, Shijiazhuang, Hebi, Anyang, Shuozhou, Taiyuan, Luliang, Qinhuangdao, Zibo, Xinxiang, Chengde, and Jincheng City; The bottom 20 cities with the worst air quality improvements were Suining, Deyang, Changsha, Yueyang, Guang'an, Nantong, Zhuzhou, Neijiang, Changde, Nanchang, Xiangtan, Ziyang, Chongqing, Jiaxing, Nanchong, Ezhou, Huanggang, Suizhou, Taizhou, and Xiaogan.
From January to June, among the 168 key cities, the top 20 cities with the lowest PM2.5 concentrations were Lhasa, Haikou, Shenzhen, Zhangjiakou, Huizhou, Zhuhai, Zhoushan, Zhongshan, Xiamen, Dongguan, Fuzhou, Guangzhou, Guiyang, Lishui, Chengde, Datong, Foshan, Jiangmen, Zhaoqing, and Huangshan City; The bottom 20 cities with the highest PM2.5 concentrations were Jingzhou, Xianyang, Shangqiu, Luohe, Xi'an, Zhoukou, Jingmen, Xiangyang, Xuchang, Kaifeng, Harbin, Anyang, Xiaogan, Fuyang, Huai'an, Huainan, Heze, Nanyang, Suqian, and Suizhou.
From January to June, among the 168 key cities, the top 20 cities with the best improvement in PM2.5 concentration levels were Baotou, Handan, Xinzhou, Linfen, Hohhot, Luliang, Jinzhong, Shuozhou, Shijiazhuang, Dongying, Jiaozuo, Yangquan, Datong, Hebi, Puyang, Taiyuan, Xingtai, Pingdingshan, Binzhou, and Xinxiang; The bottom 20 cities with the worst changes in PM2.5 concentrations were Yueyang, Changde, Guang'an, Deyang, Urumqi, Jiujiang, Nanchong, Ezhou, Xianning, Jingzhou, Anqing, Yangzhou, Zhuzhou, Nanchang, Xiaogan, Changsha, Meishan, Wuhan, Chizhou, and Chongqing.
Source: Ministry of Ecology and Environment


